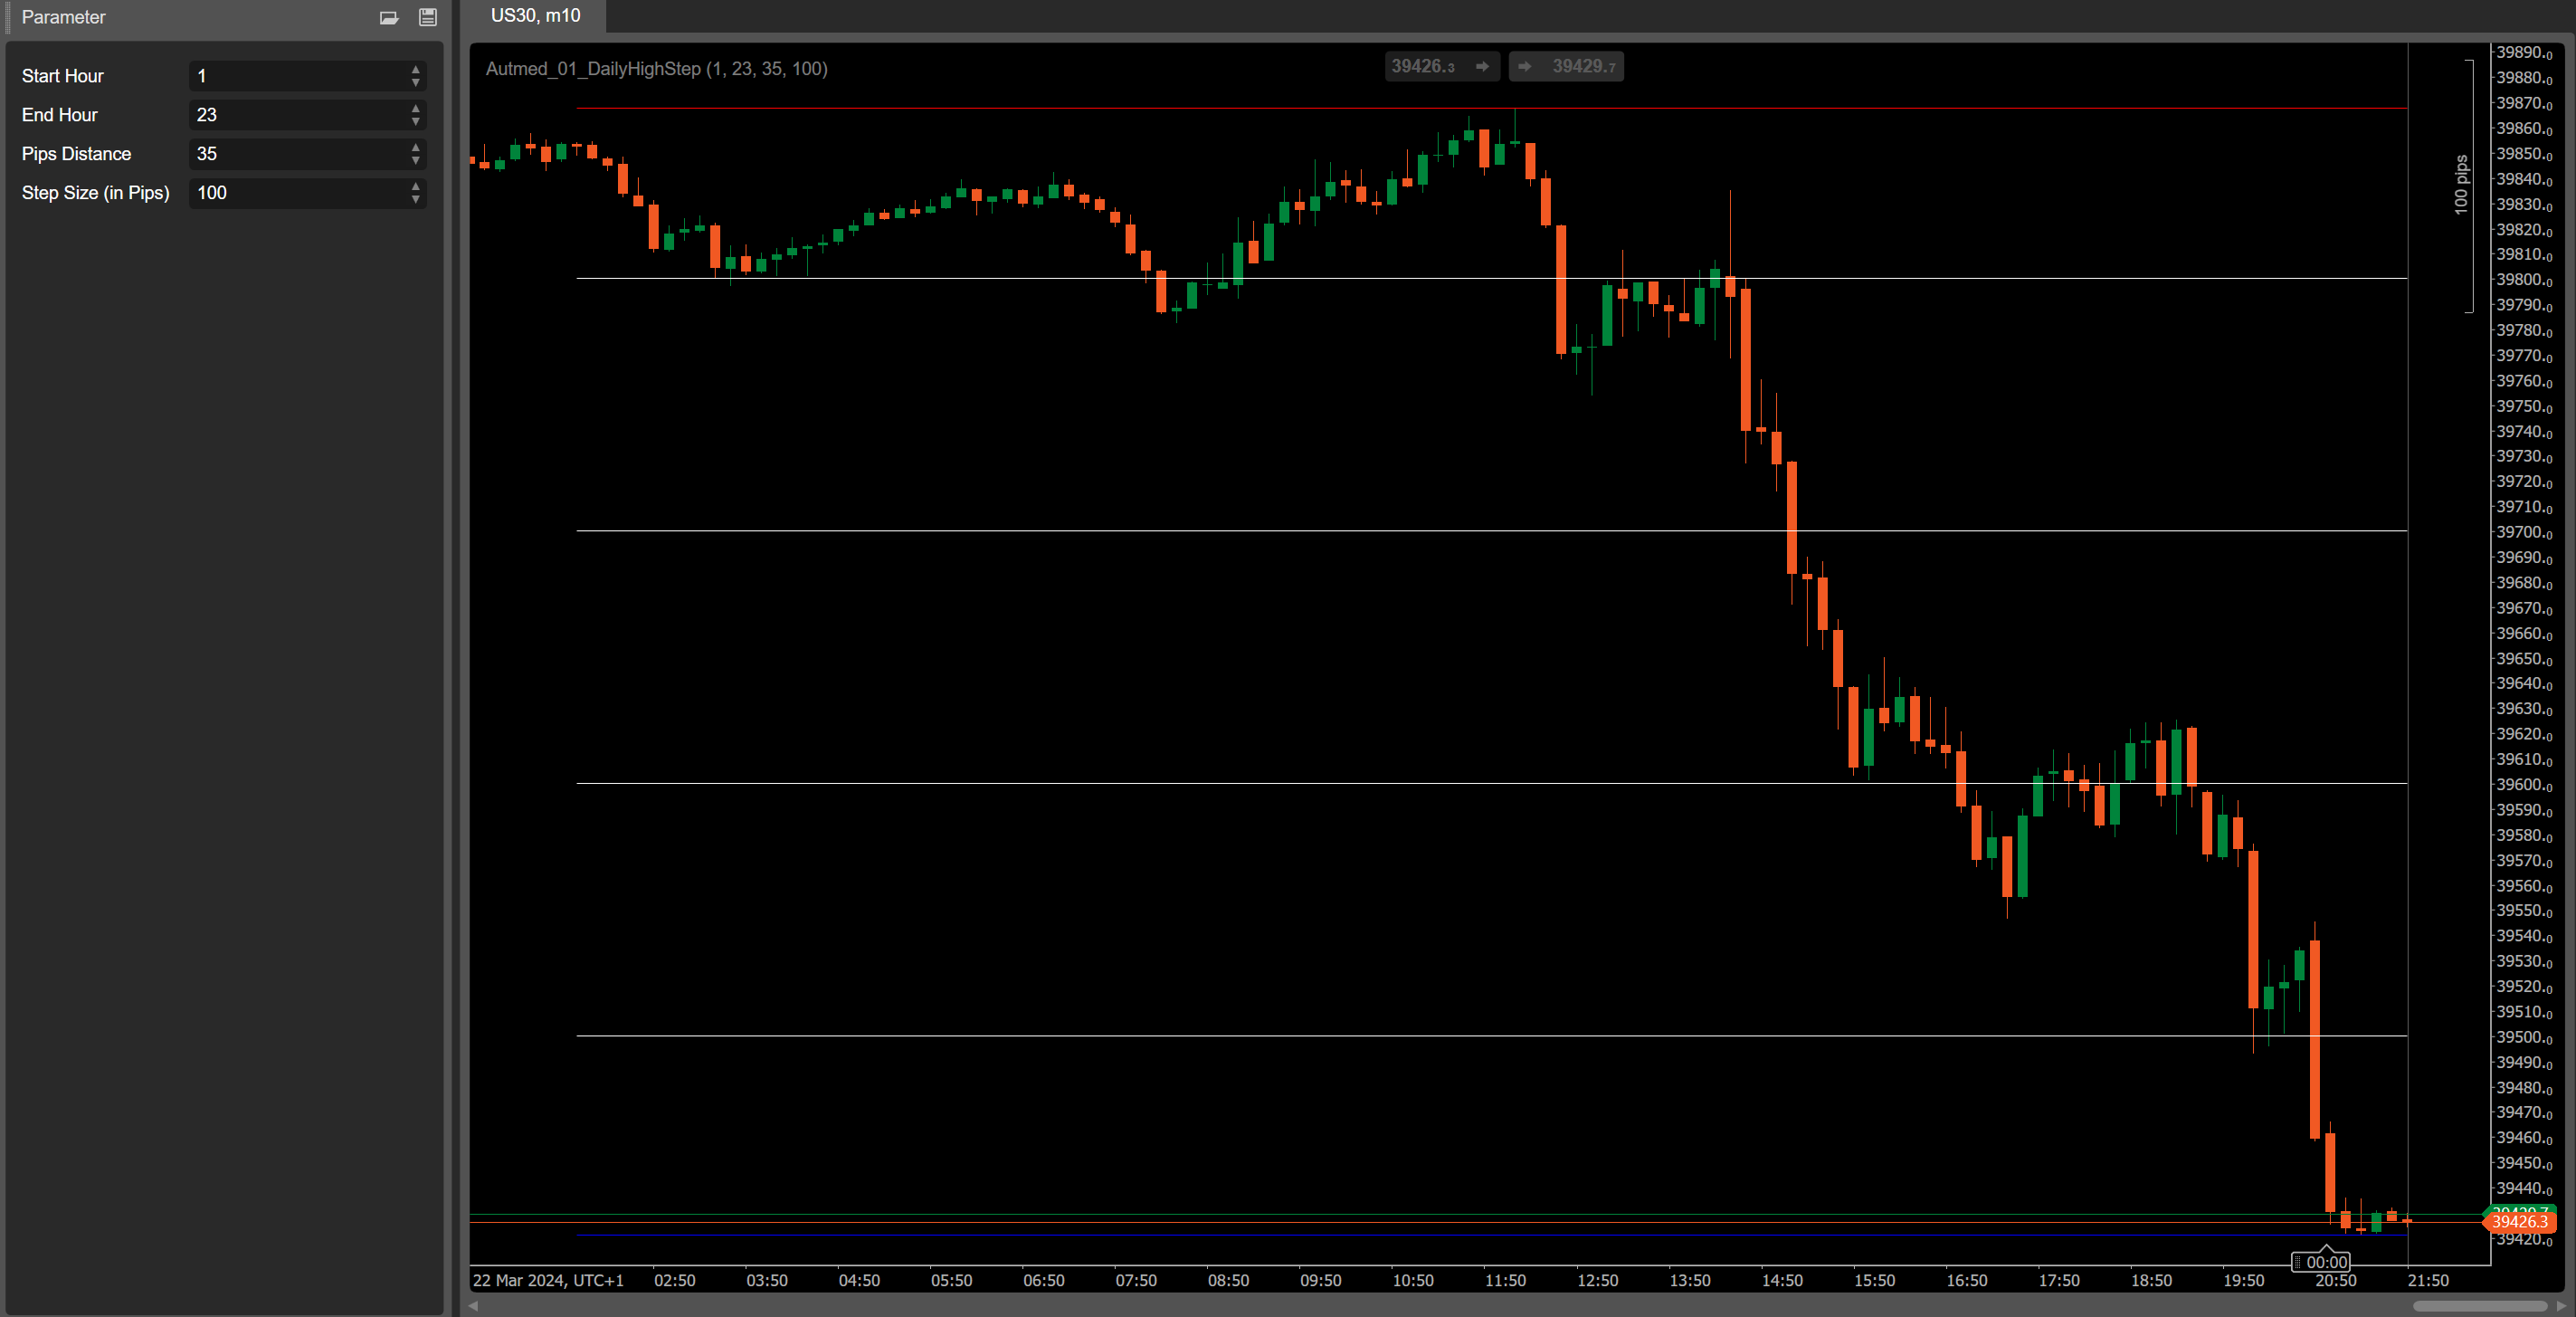
Daily High Step
The Autmed Daily High Step is a versatile cTrader indicator that allows traders to visually represent the daily highs and lows of a financial instrument. Custom settings such as start and end times allow users to focus their analysis on specific trading sessions, while adjustable pip distance and step size ensure precise delineation of price levels.
AI Finance Association Europe members receive this product at €0.00.
Register for free or become a member now!
The Daily High Step indicator for cTrader is a sophisticated tool for traders looking for an effective way to identify critical price levels within day trading. This indicator stands out for its customizability, with parameters such as the "Start Hour" and "End Hour" that allow the user to customize the times for which the daily highs and lows should be analyzed. This can be particularly useful for capturing market volatility during the opening hours of major exchanges.
Another core feature is the "Pips Distance", which determines the distance in pips to draw additional trend lines above and below the highest and lowest prices. These trend lines serve as a visual aid to identify potential support and resistance levels. Additionally, the "Step Size (in Pips)" setting offers flexible step size design to define a series of price levels that can serve as a basis for entries or exits.
These features make the Daily High Step indicator particularly useful for day traders and swing traders who require precise and customizable technical analysis. The indicator is designed to be integrated into the cTrader charting interface, providing a seamless and intuitive user experience. It can be applied to a wide range of financial instruments, making it an indispensable tool for any serious trader who wants to enrich their trading strategy with additional technical insights.
Determining the daily highs and lows within a specified time period:
The indicator's Calculate function examines the price range of a financial instrument within the user-specified hours (defined by StartHour and EndHour). It determines the highest and lowest price levels of the day to identify key price ranges for the trading day.
Dynamic adjustment of trend lines based on price actions:
The indicator draws trend lines in real time based on the highs and lows detected. These trend lines, including the additional lines defined by the PipsDistance, help traders visualize possible support and resistance zones.
Custom steps for detailed price levels:
With the DrawLines function, the indicator uses an adjustable step size (StepSizeInPips) to draw a sequence of horizontal lines above and below the highs and lows. This allows traders to follow the price movements between the highs and lows in more detail and identify additional trading signals within this range.
User-friendly customization through setting parameters:
The indicator offers easy and intuitive configuration of how the indicator works through the parameter attributes in the class. Traders can adjust the start and end time, pip distance and step size to suit their individual trading needs, resulting in a personalized trading experience.


INFO:
Once you have completed your order, the product will be available for download immediately. We thank you for your trust and wish you much success and insight with our offer.
| indicator | cTrader |
|---|
Product Reviews / Q&A
Average rating
-
Reviews (0)
- All reviews (0)
- Has image/video (0)
- Excellent (0)
- Good (0)
- Medium (0)
- Poor (0)
- Terrible (0)
-
Questions & Answers (1)
-
Latest
- Latest
- Oldest
- High rating
- Low rating
- Helpful
-
Latest
- Latest
- Oldest
- Helpful
There are no available reviews. Write your review.
There are no available questions. Ask your question.


