Every Friday, the market is screened for interesting stocks and analyzed using AI. The AI of AI FAE is specially...
Search in blog
Blog categories
- Daytrading Almanac (23) click
- Press release (14)
- Educational (13) click
- Projects (6)
- Chart analysis (21) click
- Trading bots for cTrader (11)
- AI in trading (5)
- Trading Strategien (10)
- Trading signals and stock market letters (16)
- FAQ – Your guide through the world of finance and technical facilities (1) click
Latest posts

AI STOCK SCREENING OF THE WEEK ON 06/28/2024
Read more

Trading Kids
Read more
We teach what children are not taught in school. An initiative of the AI Finance Association Europe in the context of...

New developments in loss offset limitation: Important information for traders and investors
Read more
line-height:normal"> In my recent research for AI Finance Association I have exciting news about loss offset...

AI STOCK SCREENING OF THE WEEK ON 21.06.2024
Read more
Every Friday, the market is screened for interesting stocks and analyzed using AI. The AI of AI FAE is specially...

SETTINGS FOR THE V800L2 IN THE US500 M5
Read more
I have run an optimization over several days and here is a resulting setting option for the US500 in the M5 chart
Popular posts

Trading bots: revolution or risk?
Trading bots have revolutionized the way we interact with financial markets, but they also bring their own...
Read more

Warnung vor Schneeballsystemen
In diesem Blog möchten wir darauf eingehen, was die sogenannten Schneeballsysteme auszeichnet, wie sie sie erkennen...
Read more

AI Finance Association Europe: Innovation in finance through weekly bot developments
Vienna, April 8, 2024 – The AI Finance Association Europe, a leading association for innovation in the financial...
Read more

The V300L1 trading bot – your automated path to success on the financial markets
Getting started with automated trading
In a world where financial markets never sleep, the V300L1 trading bot offers...
Read more

The V430L01 Trading Bot: Revolutionize your Forex trading
In the world of Forex trading, every trader is looking for the golden key to predict market movements and maximize...
Read more
Featured posts

Day Trading Almanac Foreword
The "Day Trading Almanac" is a comprehensive guide put together by the Daytrading Elite Facebook group. This book...
Read more

Was ist Daytrading
In the world of financial trading, day trading is a term often associated with excitement, risk and quick decisions....
Read more

Requirements for entry
To start day trading successfully, there are basic knowledge and skills that you need to learn as well as certain...
Read more

History of day trading
Day trading, the fascinating art of buying and selling securities within a single trading day, has evolved...
Read more

Choosing the right trading platform
Discover the most important functions and tools that are crucial when choosing the right trading platform for day...
Read more
Photo gallery
No featured images
Archived posts
Top authors


AI FAE TRADING BASIC COURSE CHAPTER 5
Technical Analysis
Introduction
Technical analysis is an approach to predicting the future price movements of financial instruments such as shares, currencies or Commodities by examining historical market data, mainly Price and volume. It is based on the assumption that market prices follow trends and that these trends are identified through the analysis of market data can be.
Top Down Method
The top down method of technical analysis begins with the Examining major indices or markets to determine the general market direction before committing to specific stocks or assets This approach helps traders make decisions in line with the overarching market trends and thereby reduce the risk of To minimize counter movements.
Trend and trend building
Trend and trend building
In technical analysis, a trend refers to the Direction in which the market is moving. Trends can be up, down or sideways. The trend structure refers to the patterns and Behaviors that lead to the formation of a trend. An upward trend is characterized by higher highs and higher lows, while a descending trend characterized by lower highs and lower lows A sideways trend shows consistent highs and lows. These patterns help traders identify potential entry and exit points and their Adapt strategies accordingly.
Example sideways trend:
Example downward trend:
Example uptrend:
Trend phases
In technical analysis, trend phases are referred to as crucial periods in which a trend develops and These phases can be divided into three main categories:
- Accumulation phase: This is often the beginning of a new trend in which informed investors start building positions before the general public does. In During this phase, the market is often relatively flat, as the previous trend subsides and the first signs of a new trend emerge.
Example accumulation phase:
- Participation phase: This is where the majority of traders and investors enter, which drives the trend strengthened and prices moved significantly in the trend direction. This phase is due to increased trading activity and rising prices in a Uptrend or falling prices in a downtrend.
Example participation phase:

- Distribution phase: In this phase, early investors begin to accumulate their profits and the trend gradually loses strength. This can lead to lead to a trend reversal if enough market participants decide to close their positions.
Example distribution phase:
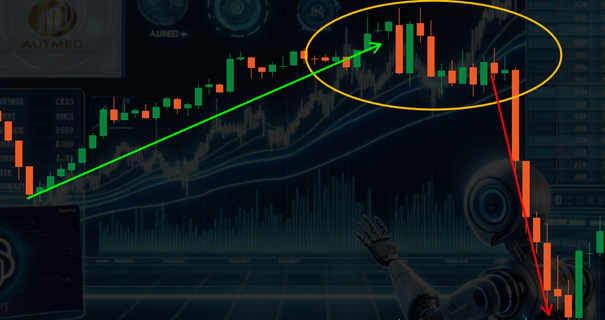
Recognizing these phases can help traders to and plan exit strategies more effectively and minimize risk.
Trend line and trend channels
Trend lines and trend channels are important tools in technical analysis, which serves to determine the direction and stability of a to visualize trends.
- Trend lines are straight lines that either pass under the low points (in a uptrend) or above the highs (in a downtrend) of a Price charts are drawn. They help to identify the support or Identify resistance levels where prices tend to to reverse.
Example 1 trend line:
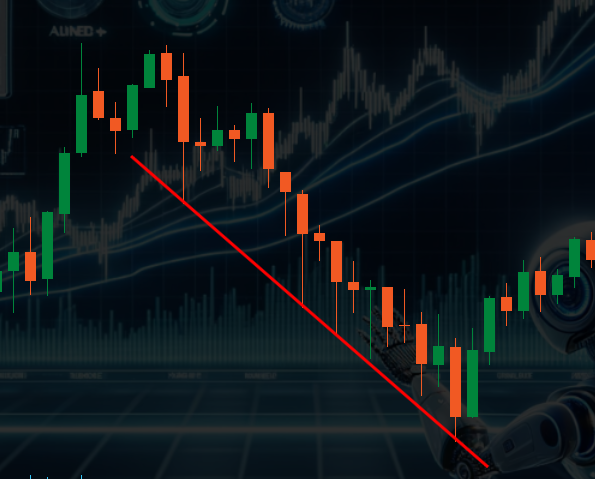
Example 2 trend line:
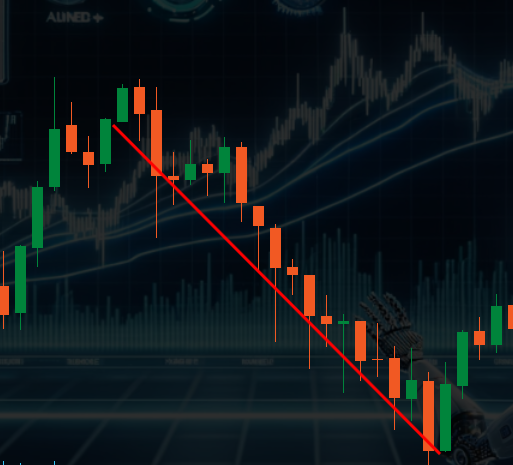
Some traders prefer the candle bodies, others the ends of the Candle wicks. The idea behind the trend lines is that when creating of these trends and accordingly at the trend line with a position.
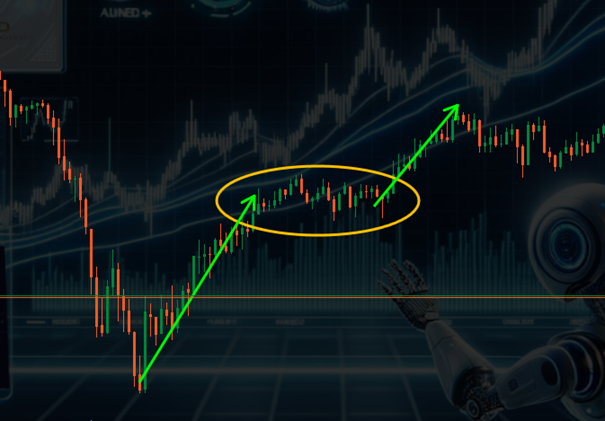
- Trend channels extend this concept by adding a second line parallel to the trend line This creates a channel that further more precisely. An ascending trend channel shows ascending highs and lows, while a descending trend channel forms falling highs and lows shows.
Example trend channel:
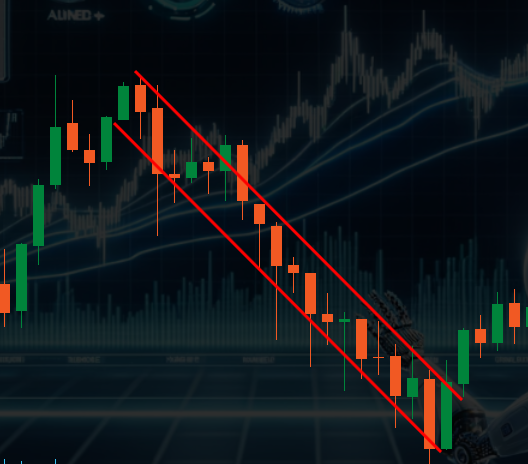
As can be seen in the example of a trend channel, Not everything on the chart is symmetrically perfect. There is always upward and small outliers below.
These tools are particularly useful for identifying possible and exit points in the market and to improve risk management by highlighting areas where trends may be lose strength or break.
Support and resistance
Support and resistance are fundamental concepts in of technical analysis, which describe areas on the chart where the Price tends to stop and reverse. As important zones for support and resistances are mainly Value Area Low, Value Area High, Inbalances, Hourly reversals, VPOC, pivot points, etc. However, this basic course will not discussed further
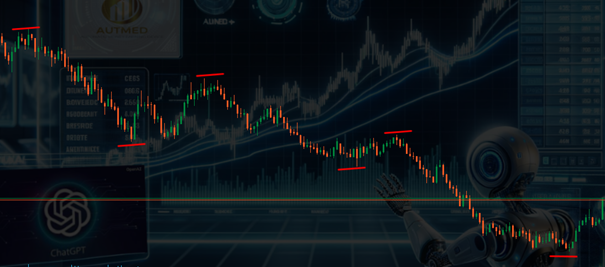
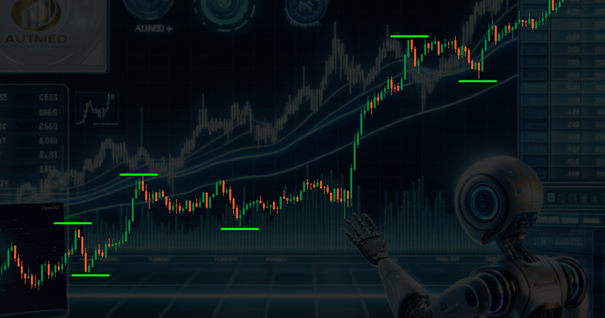
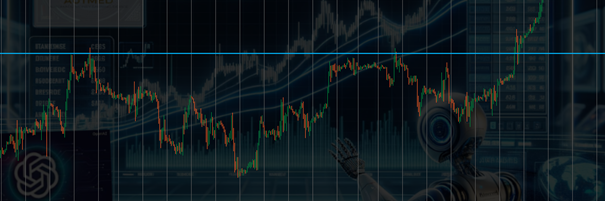
- Support is the level below which the price rarely falls. It is called the Bottom from which the price tends to bounce upwards.
Example support:
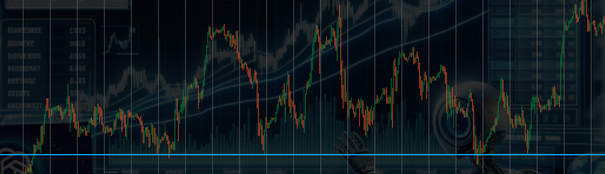
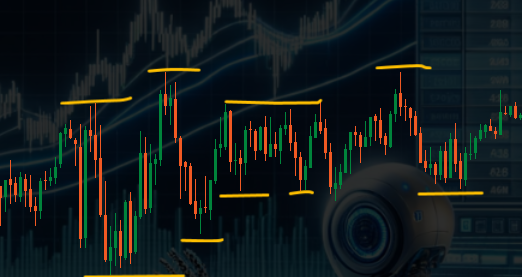
- Resistance is the level above which the price rarely rises. It acts as a kind of Cap that pushes the price down.
Example resistance:
These levels are determined by observing the Price history identifies where the price repeatedly stops falling or to rise. They are important for setting stop-loss and Take-profit orders, as they often mark areas where prices show significant reactions.
Retracements
Retracements are temporary price declines within a larger market trends, which often act as corrections to the overall price trend As part of technical analysis, traders use retracements, to identify potential entry points in the direction of the prevailing trend They are often identified by Fibonacci levels or other technical Indicators that show how deep a decline is likely, before the original trend resumes. Retracements are particularly useful in strongly trend-oriented markets to find favorable buying or Finding selling moments within a larger trend.
Example Fibonacci Retracements:
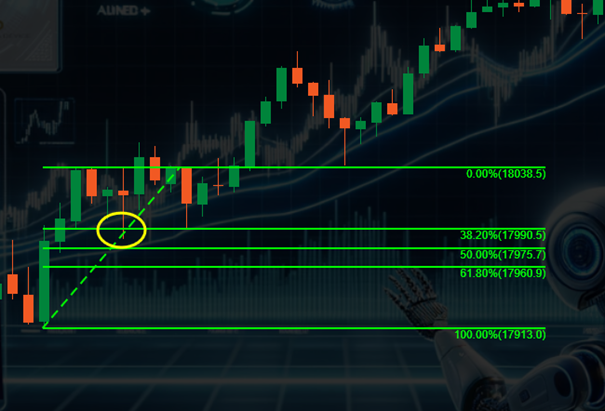
In this case you would have a buy limit at the 38.2% level You can place orders. However, the levels vary between the tradable symbols strong. Often the 50% and 70% levels are even more noticeable.
Chart formations
Chart formations are patterns that appear in the price of a security can be seen on a chart and used by traders to predict future market movements. These formations can be divided into two main categories: Continuation formations, which indicate that an existing trend is likely to continue, and reversal formations, that indicate an impending trend reversal. Popular examples of Chart formations are triangles, flags and pennants (continued), as well as double top and double bottom (reversal). Traders use these patterns to identify entry and To determine exit points. Here are a few examples:
Example Bullish Flag:
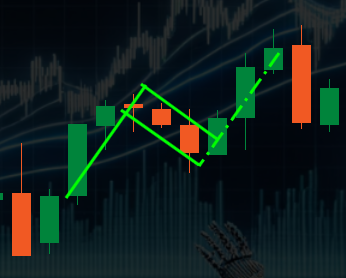
A bullish flag must have at least three support points of the Candle body corners. It has a probability of about 66% that it as in this example.
Example rectangle:
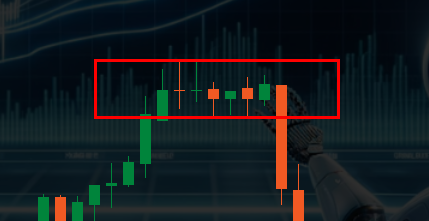
With a rectangle, one could break out of this or even dare to enter aggressively by playing on the outside edge acts in the opposite direction
There are a variety of other formations such as various Triangles, double top, double bottom, shoulder-head-shoulder etc. These are This basic course will not be discussed further, as it has the basic knowledge go out.
Indicators
Indicators in technical analysis are mathematical calculations based on historical price and/or volume data of a security and are used to predict future to predict market movements. The most common indicators include:
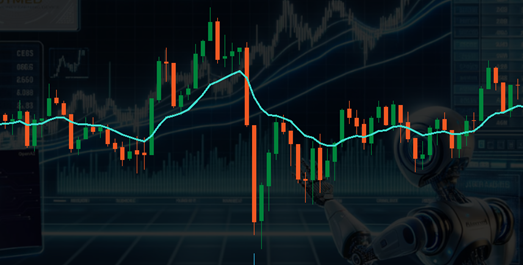
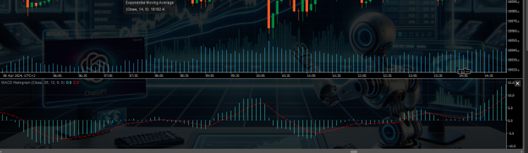
- Moving Averages (moving averages) : Show the average Price of a security over a certain period of time and smooth Price fluctuations.
Example exponential moving average 14:
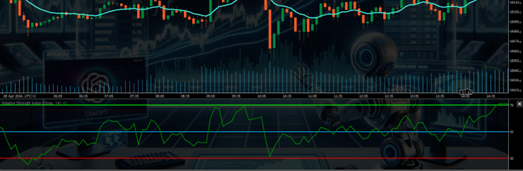
- Relative Strength Index (RSI) : Measures the extent of price gains in comparison to price losses and signals overbought or oversold Conditions.
Example RSI14:
- MACD (Moving Average Convergence Divergence) : Shows the convergence or Divergence of two moving averages.
Example MACD histogram:
- Bollinger Bands : Consist of a middle band (a sliding average) and two outer bands representing a standard deviation from the middle band and indicate market volatility.
Example Bollinger Bands 20:
These indicators help traders identify trends, identify possible reversal points and make trading decisions.
Conclusion on indicators: There are countless indicators. However, many indicators always say the same thing. Basically, Indicators always only show past values. Indicators work always only in certain market phases. If the market changes, the also the set values of the indicators, which may then become useless. There is no “holy grail” of indicators. In combination, they can but provide a good basis for trading decisions. The trading platforms offer the “standard indicators” usually free of charge. Special Indicators are made available by and for members of AIFAE, for example placed.
Example analysis
Example analysis with technical indicators:
Let us imagine that we are analyzing the stock of Company X with the Moving Average (MA), the Relative Strength Index (RSI) and the Bollinger Bands to make an informed trading decision:
- Moving Average: Company X’s stock recently crossed the 50-day MA of broken through from bottom to top, indicating a possible uptrend indicates.
- RSI: The RSI value is at 70, which is close to the overbought zone. This could indicate that the stock is overvalued and may soon could undergo a correction.
- Bollinger Bands: The price touches the upper band, which together with a high RSI could indicate an overbought phase.
Based on this analysis, traders could consider a Open position if further signals indicate a continuation of the uptrend confirm, or secure profits if they have already invested in the stock to protect against a possible reversal.
Posted in:
AI FAE Trading Basics

Latest comments