Between reality and illusion If you want to know what trading really means—beyond luxury cars, piles of cash, and...
Search in blog
Blog categories
- FAQ – Your guide through the world of finance and technical facilities (2) click
- Daytrading Almanac (27) click
- Press release (23)
- Educational (26) click
- Projects (9)
- Chart analysis (39) click
- Trading bots for cTrader (11)
- AI in trading (5)
- Trading Strategien (11)
- Trading signals and stock market letters (46)
Latest posts

When it comes to traders, social media platforms often create a rather one-sided image: a young face smiling at the...

The TegasFX Instant Funding program sets a new standard for traders seeking quick access to capital without having to...

Backtesting trading strategies is an essential tool for traders who want to validate their methods across historical...

introduction In the world of trading, it can be challenging to balance the intense market activity and the rapid...
Popular posts


Featured posts


Photo gallery
No featured images
Archived posts
Top authors
-
 Christian Lill 70 Posts View posts
 -

-

-

-

3 Moving Averages Trading Strategy – A Comprehensive Guide
In this article, we will introduce you to a proven trading strategy based on the use of three moving averages (MA) . This strategy is suitable for both long and short positions and offers clear signals for entries and exits. The three different moving averages help to better identify trends and make informed decisions.
The 3 moving averages in detail
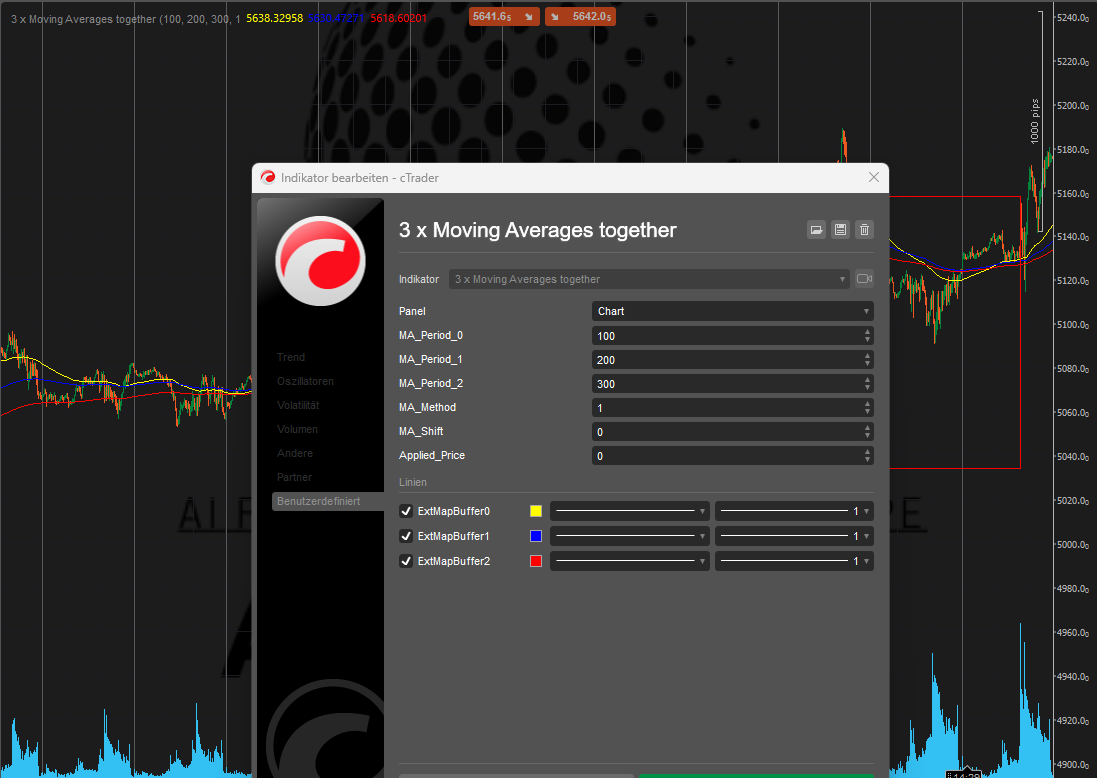
- MA 100 (Yellow) : This moving average reacts quickly to market movements and reflects the short-term trend.
- MA 200 (Blue) : The medium-term indicator smoothes out short-term fluctuations and helps to identify the overall trend.
- MA 300 (Red) : The long-term trend indicator provides information about the general market development and serves as a filter for volatile movements.
These three MAs are clearly visible in the chart and enable visual trend analysis.

Entry into long positions
A buy signal occurs when the short-term MA (yellow) crosses above the medium-term (blue) and long-term (red) MAs from below. This indicates a trend reversal to the upside and provides an opportunity to open a long position .
Example in the chart : The yellow MA crosses the blue and red lines, indicating a bullish market movement. This is a strong indicator to make the purchase.
When no trading takes place: The sideways phase
There are market phases in which the three moving averages move very close to each other and no clear intersections are formed. This indicates a sideways market in which there are no clear trading signals. In such phases, which are marked in red on the chart, it is advisable to stay away from the market as no clear direction can be seen.

Entry into short positions
Entry into short positions
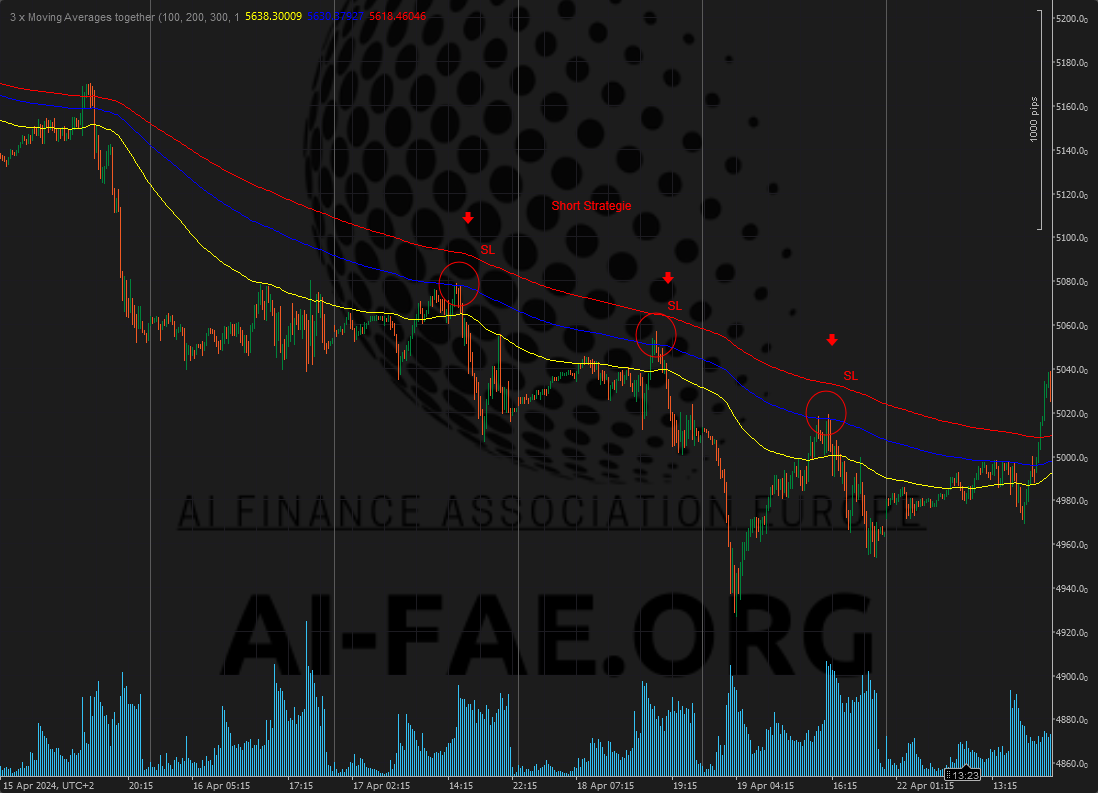
Conversely, a short signal occurs when the yellow MA crosses the blue and red lines from top to bottom. This signals a bearish trend reversal and a good opportunity to open a short position .
Example in the chart : The yellow MA breaks the blue and red lines downwards. This indicates that a short trade should be considered.

Adapting the strategy to different markets
It is important to emphasize that the moving average settings should be customized for each asset. Different markets and time frames require different periods for the MAs, so before applying this strategy to a new market, it should be verified and optimized with backtesting .
Diversification for higher chances of success
To maximize the probability of success, we recommend applying this strategy to at least 10 different assets . By spreading the trades across different markets, you reduce risk and increase the chance of profiting from different market movements.
Supplementation by oscillators
For additional security when entering, you can use an oscillator such as the RSI (Relative Strength Index) or the MACD (Moving Average Convergence Divergence) as needed. These indicators help to identify overbought or oversold market situations.
- Example : If the moving averages are showing a buy signal but the RSI is indicating overbought conditions, it might make sense to wait to enter or proceed more cautiously.
Be careful with too many indicators
Although additional indicators can help confirm an entry, the more indicators used, the lower the likelihood of a clear signal. Too many confirmations can lead to missing the ideal entry point or conflicting signals.
Important : Find the optimal mix of indicators that suits your trading style and the markets you choose through backtesting . This will increase the likelihood of making consistent profits without missing too many trading opportunities.
Conclusion
The 3 Moving Averages strategy offers a clear and precise method to identify trends and place profitable trades. By adapting to different markets and possibly using additional indicators, traders can further increase their probability of success. However, the strategy and its parameters should always be validated with backtests and regularly optimized to respond to changing market conditions.
Leave a comment
Related posts
 Adjustment of trading sizes
 Setting stop loss and take profit
 Diversification
 Use technical analysis
