Between reality and illusion If you want to know what trading really means—beyond luxury cars, piles of cash, and...
Search in blog
Blog categories
- FAQ – Your guide through the world of finance and technical facilities (2) click
- Daytrading Almanac (27) click
- Press release (23)
- Educational (26) click
- Projects (9)
- Chart analysis (39) click
- Trading bots for cTrader (11)
- AI in trading (5)
- Trading Strategien (11)
- Trading signals and stock market letters (46)
Latest posts
When it comes to traders, social media platforms often create a rather one-sided image: a young face smiling at the...

The TegasFX Instant Funding program sets a new standard for traders seeking quick access to capital without having to...

Backtesting trading strategies is an essential tool for traders who want to validate their methods across historical...

introduction In the world of trading, it can be challenging to balance the intense market activity and the rapid...
Popular posts



Featured posts



Photo gallery
No featured images
Archived posts
Top authors
-
 Christian Lill 70 Posts View posts
 -

-

-

-

Trading Depot Overview - The 1-Year Anniversary - Trading Insights on One Year of Transparent Trading
depot review
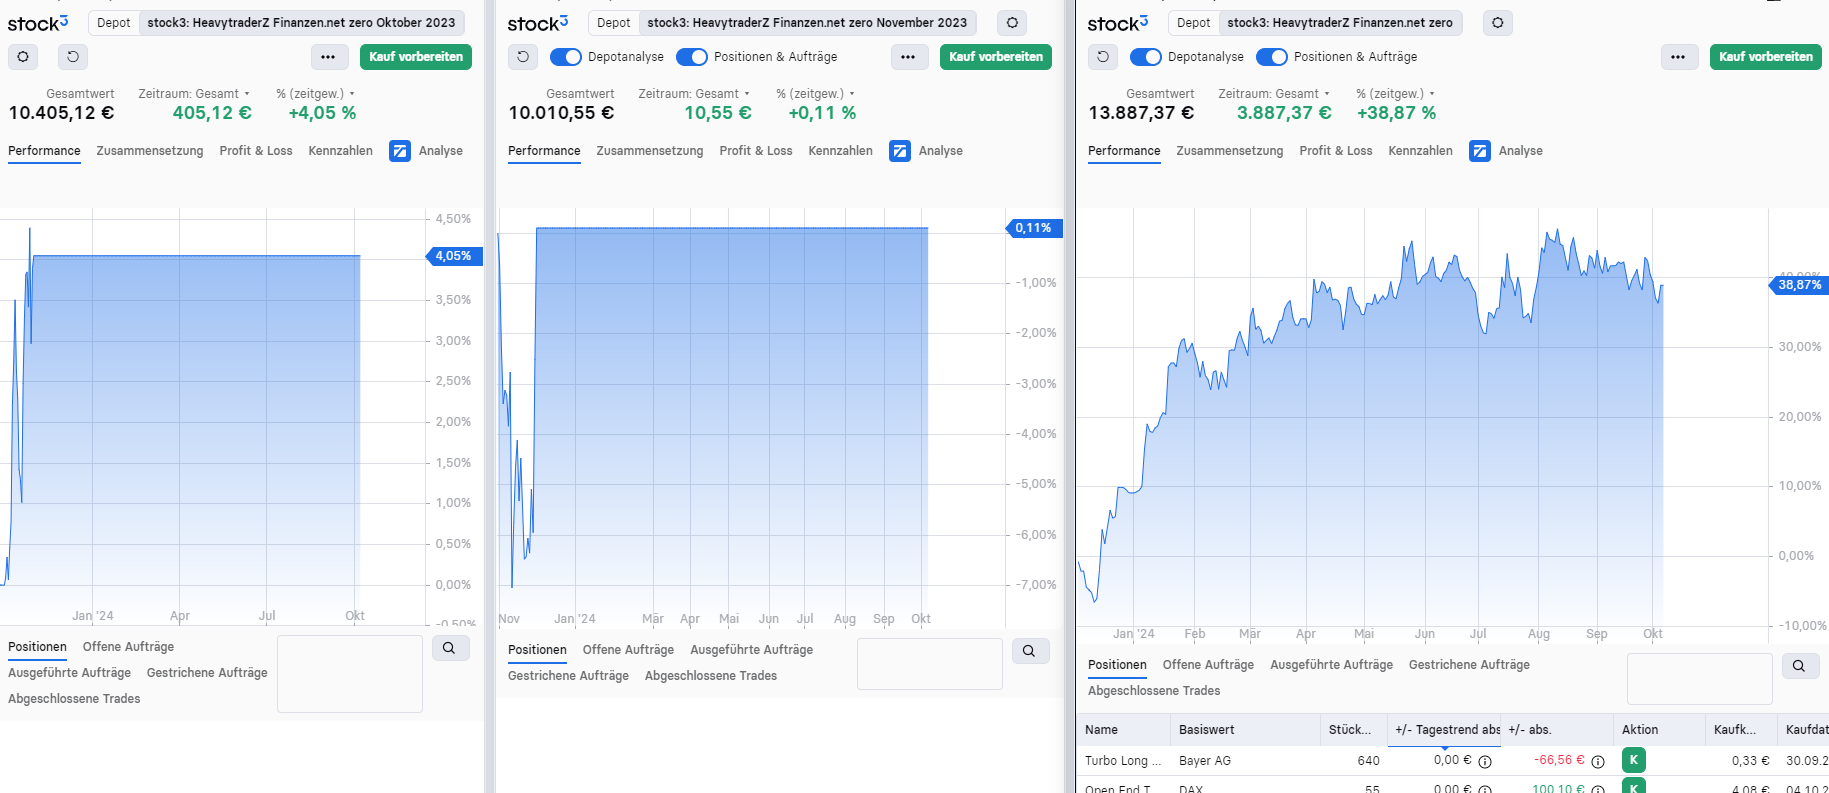
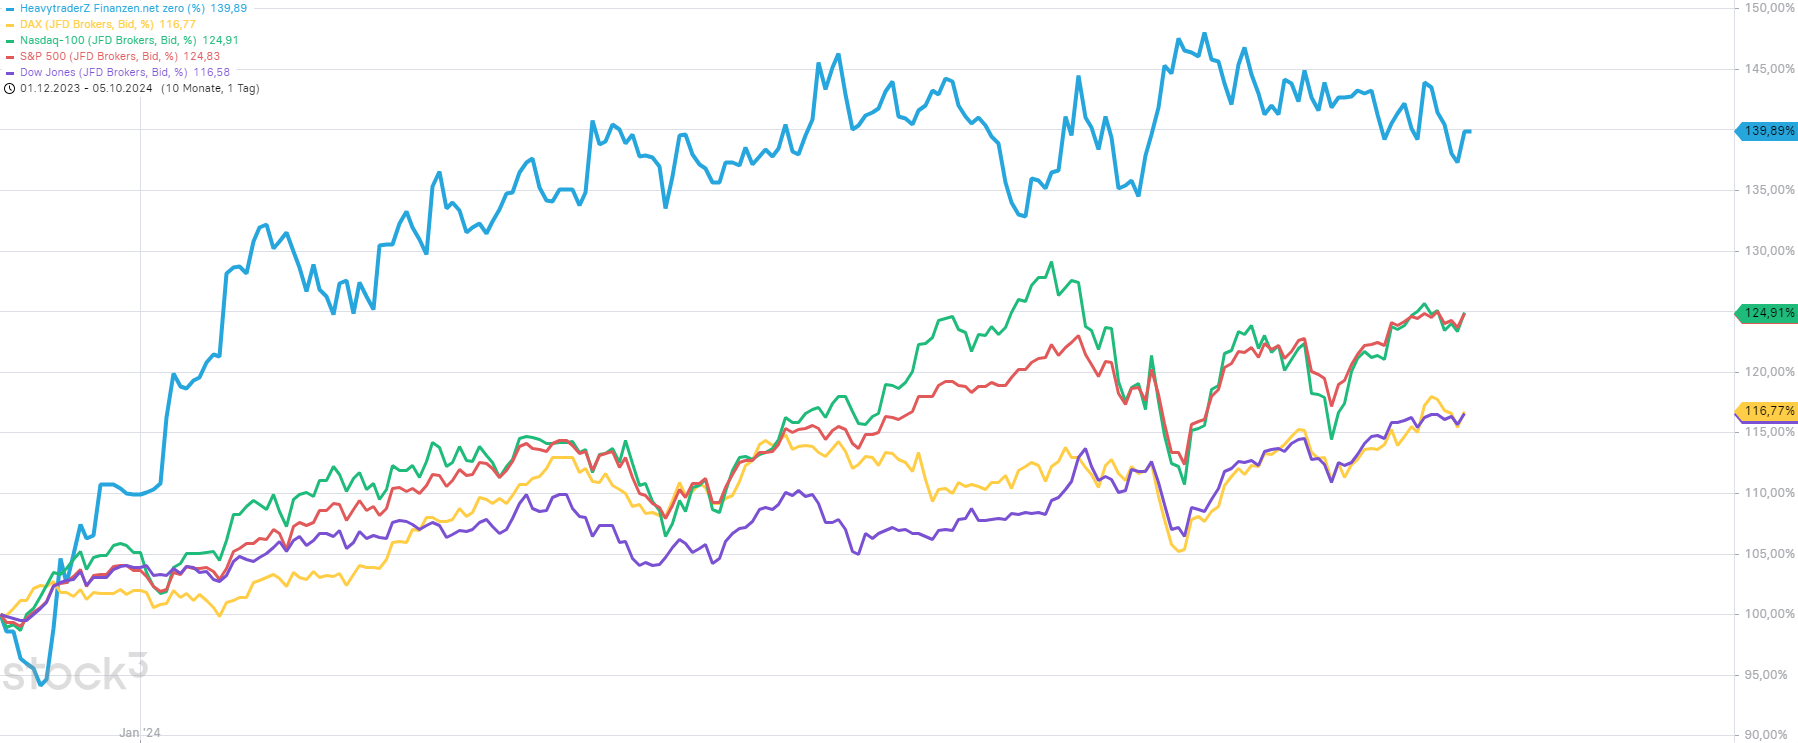
Since I have had a public portfolio since October 1st, 2023, I have been able to achieve a decent portfolio growth, which I would like to show you today. While the profits from the EUR 10,000 portfolio were still being skimmed off in the first two months, the portfolio has been running continuously since December 1st, 2023. Overall, I was able to generate a whopping portfolio growth of 43.57% (as of October 2nd, 2024). For me personally, this is a fantastic result! A nice add-on - I didn't close a single month with a negative portfolio performance.
trading strategy
How could such a result come about, most community members will ask themselves?
The answer is quite simple. I have found a trading strategy for myself for several years now that is profitable and can be implemented consistently within swing trading. I do the same thing every day and use just three trading approaches: procyclical breakout trading + anticyclical trend trading + CRV trading. If you have a strategy that is profitable, you just need to combine it with the right risk money management, otherwise you would not be able to achieve such results. Personally, it is important to me that I earn money consistently rather than making a lot of money quickly. That is why I use the 1-R method in trading. I risk a maximum of 1% of my portfolio volume per position if the trade is stopped out. In return, I was able to achieve an outperformance of 14.98% compared to the best index. An absolute reward for me!
performance indicators
Although all trades in our Plus section have been published in a comprehensible and transparent manner, I would still like to take the opportunity to explain my performance metrics to you:
Trades executed 269
hit rate: 49%
Profit factor: 1.31
Max Drawdown: 9.17%
(Average monthly performance: 3.63%)
Trades executed:
269 trades executed is quite a lot in a trading year that is much less than 365 days. That equates to one trade every trading day. I am a fairly active trader, which of course corresponds to my short-term holding period for swing trading, and I also like to take advantage of my trading opportunities.
hit rate:
This will probably make most people wonder. How can it be that only 49% of all trades were closed with a profit, given such an annual performance? Losing trades only ever lose 1% of the portfolio volume, whereas winning trades yield significantly more. CRV trading, for example, which has a very low probability of success, results in a disproportionately high number of trades being closed with a loss.
Profit factor:
This figure shows how many euros were earned for each euro invested. So for every euro invested, I earned EUR 0.31 - for EVERY one. This is because the winning trades yield significantly more than the losing trades in losses. The profit factor is of course closely related to the hit rate.
Max Drawdown:
The key figure shows how high the interim loss of the entire portfolio performance was. At its maximum, the portfolio was 9.17% lower than an interim high. For me, this is more than acceptable given my trading approach.
In addition to the blog that is actively maintained here, my information portal Investment.Traders contains other exciting articles, detailed stock analyses, presentations of various investment opportunities and a weekly update in video form. This is my contribution to financial education in Germany.
Leave a comment
Related posts
 AI stock screening of the week on April 19, 2024
 AI STOCK SCREENING OF THE WEEK ON 04/26/2024
 AI stock screening of the week on 03.05.2024
 AI STOCK SCREENING OF THE WEEK ON 10.05.2024

