Between reality and illusion If you want to know what trading really means—beyond luxury cars, piles of cash, and...
Search in blog
Blog categories
- FAQ – Your guide through the world of finance and technical facilities (2) click
- Daytrading Almanac (27) click
- Press release (23)
- Educational (26) click
- Projects (9)
- Chart analysis (39) click
- Trading bots for cTrader (11)
- AI in trading (5)
- Trading Strategien (11)
- Trading signals and stock market letters (46)
Latest posts

When it comes to traders, social media platforms often create a rather one-sided image: a young face smiling at the...

The TegasFX Instant Funding program sets a new standard for traders seeking quick access to capital without having to...

Backtesting trading strategies is an essential tool for traders who want to validate their methods across historical...

introduction In the world of trading, it can be challenging to balance the intense market activity and the rapid...
Popular posts


Featured posts


Photo gallery
No featured images
Archived posts
Top authors
-
 Christian Lill 70 Posts View posts
 -

-

-

-

ACS - Make or Break Scenario for a Trade
Company description
ACS Actividades de Construccion y Servicios SA carries out construction and service activities for infrastructure and energy projects. In addition to infrastructure-related developments, the company constructs buildings and projects related to the mining sector. The company has four business segments: Construction (which accounts for the majority of total revenue), Concessions, Services (which offers comprehensive maintenance services for buildings, public places and organizations) and Corporate. The public company is a large-cap company in the Spanish benchmark index IBEX 35.
Chart technical outlook
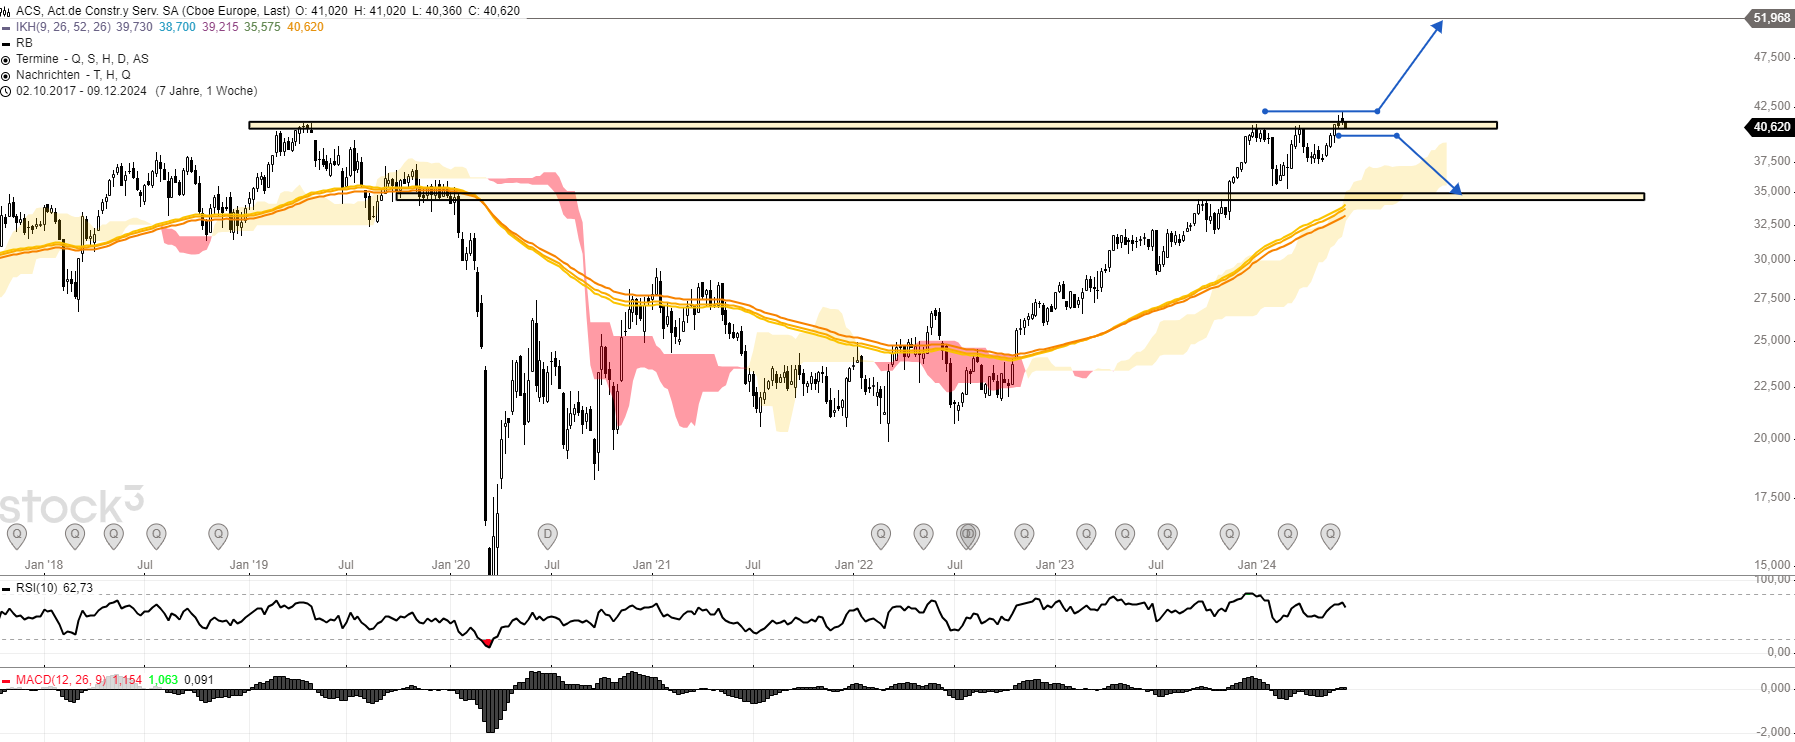
The chart so far shows a classic make-or-break scenario. I really like this one and would like to implement it for a trading position.
ACS shares set new record highs in the last trading week, breaking out of the massive resistance area of EUR 41. At the same time, however, the constellation of candles in the weekly chart shows a lot of uncertainty.

This is also a clear make-or-break scenario for me as a trader. A clear bullish sign would be if market participants were to buy the stock again and set a new record high. This would correspond to a classic breakout-pullback scenario and ensure that prices continue to rise. For this, I am targeting a price range of just under EUR 52.
A short position could certainly be worth considering if the share price closes the week below the breakout zone of EUR 40. The sellers would then very likely continue to push the share down. I expect the first reaction to be the price zone of EUR 35.

While I personally would prefer a classic breakout scenario based on market technology, an anti-cyclical short position with an attractive CRV shines. The important thing is the weekly close below EUR 40 or a new record high - now it's time to be patient and then trade the simple opportunities as profitably as possible.

In addition to the blog that is actively maintained here, my information portal Investment.Traders contains other exciting articles, detailed stock analyses, presentations of various investment opportunities and a weekly update in video form. This is my contribution to financial education in Germany.
Leave a comment
Related posts
 Munich Re - One record chases the next
 Eli Lilly - Range breakout sets new all-time highs
 Puma - Ideal correction invites you to buy
 AMD shares: AI chips boost the company -- Current buying opportunity
