Between reality and illusion If you want to know what trading really means—beyond luxury cars, piles of cash, and...
Search in blog
Blog categories
- FAQ – Your guide through the world of finance and technical facilities (2) click
- Daytrading Almanac (27) click
- Press release (23)
- Educational (26) click
- Projects (9)
- Chart analysis (39) click
- Trading bots for cTrader (11)
- AI in trading (5)
- Trading Strategien (11)
- Trading signals and stock market letters (46)
Latest posts

Are traders millionaires? – The truth behind the social media myth
Read more

Mythos Trader – How Social Media Creates a Distorted Image
Read more
When it comes to traders, social media platforms often create a rather one-sided image: a young face smiling at the...

TegasFX Instant Funding Program: The Gamechanger for Traders
Read more
The TegasFX Instant Funding program sets a new standard for traders seeking quick access to capital without having to...

The Benefits of Backtesting Trading Strategies: Detailed Insights for Beginners and Pros
Read more
Backtesting trading strategies is an essential tool for traders who want to validate their methods across historical...

Finding the Balance: Trading and Family Life" – A Guide for Trading Mothers
Read more
introduction In the world of trading, it can be challenging to balance the intense market activity and the rapid...
Popular posts

Trading bots: revolution or risk?
Trading bots have revolutionized the way we interact with financial markets, but they also bring their own...
Read more

AI Finance Association Europe: Innovation in finance through weekly bot developments
Vienna, April 8, 2024 – The AI Finance Association Europe, a leading association for innovation in the financial...
Read more

The V300L1 trading bot – your automated path to success on the financial markets
Getting started with automated trading
In a world where financial markets never sleep, the V300L1 trading bot offers...
Read more

Warnung vor Schneeballsystemen
In diesem Blog möchten wir darauf eingehen, was die sogenannten Schneeballsysteme auszeichnet, wie sie sie erkennen...
Read more

Trading Depot Overview - My experiences from the last trading week
Every week I would like to share with you an update of my trading strategy, which I implement in the area of swing...
Read more
Featured posts
Are traders millionaires? – The truth behind the social media myth
Between reality and illusion
If you want to know what trading really means—beyond luxury cars, piles of cash, and...
Read more
Mythos Trader – How Social Media Creates a Distorted Image
When it comes to traders, social media platforms often create a rather one-sided image: a young face smiling at the...
Read more

Why a good trading coach doesn’t have to be a profitable trader
There is a widespread assumption in the world of trading that a successful trader must automatically be a good coach....
Read more
TegasFX Instant Funding Program: The Gamechanger for Traders
The TegasFX Instant Funding program sets a new standard for traders seeking quick access to capital without having to...
Read more
The Benefits of Backtesting Trading Strategies: Detailed Insights for Beginners and Pros
Backtesting trading strategies is an essential tool for traders who want to validate their methods across historical...
Read more
Photo gallery
No featured images
Archived posts
Top authors


Natural Gas - Multiplication possible -- I'm going to fill up!
Seasonality
The price of gas has also been a political football since and around Corona. In addition to various price increases and extreme movements, the price of natural gas has ultimately fallen to significant lows. The extreme pricing has now calmed down and a lot has been happening here since February of this year. I really like the movement of the price of natural gas. This chart structure actually tends to suggest another gas price rally. According to this, the underlying value could almost double over the next few weeks. Over the next few quarters it could even triple - but first let's take a look at the upcoming seasonality:
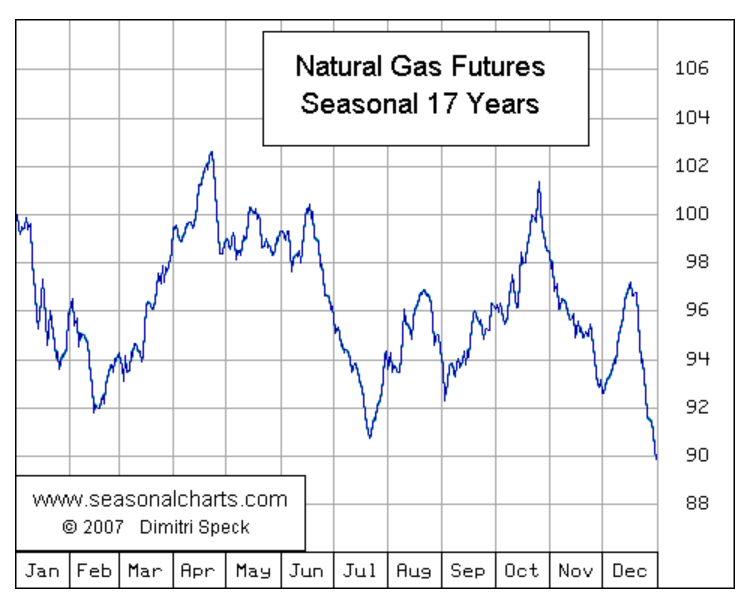
It is very clear that according to statistical seasonality, a massive reversal is likely in July. This should last until mid-August. I would like to take advantage of this as well. Because, as I described, I also really like what is happening in the charts.
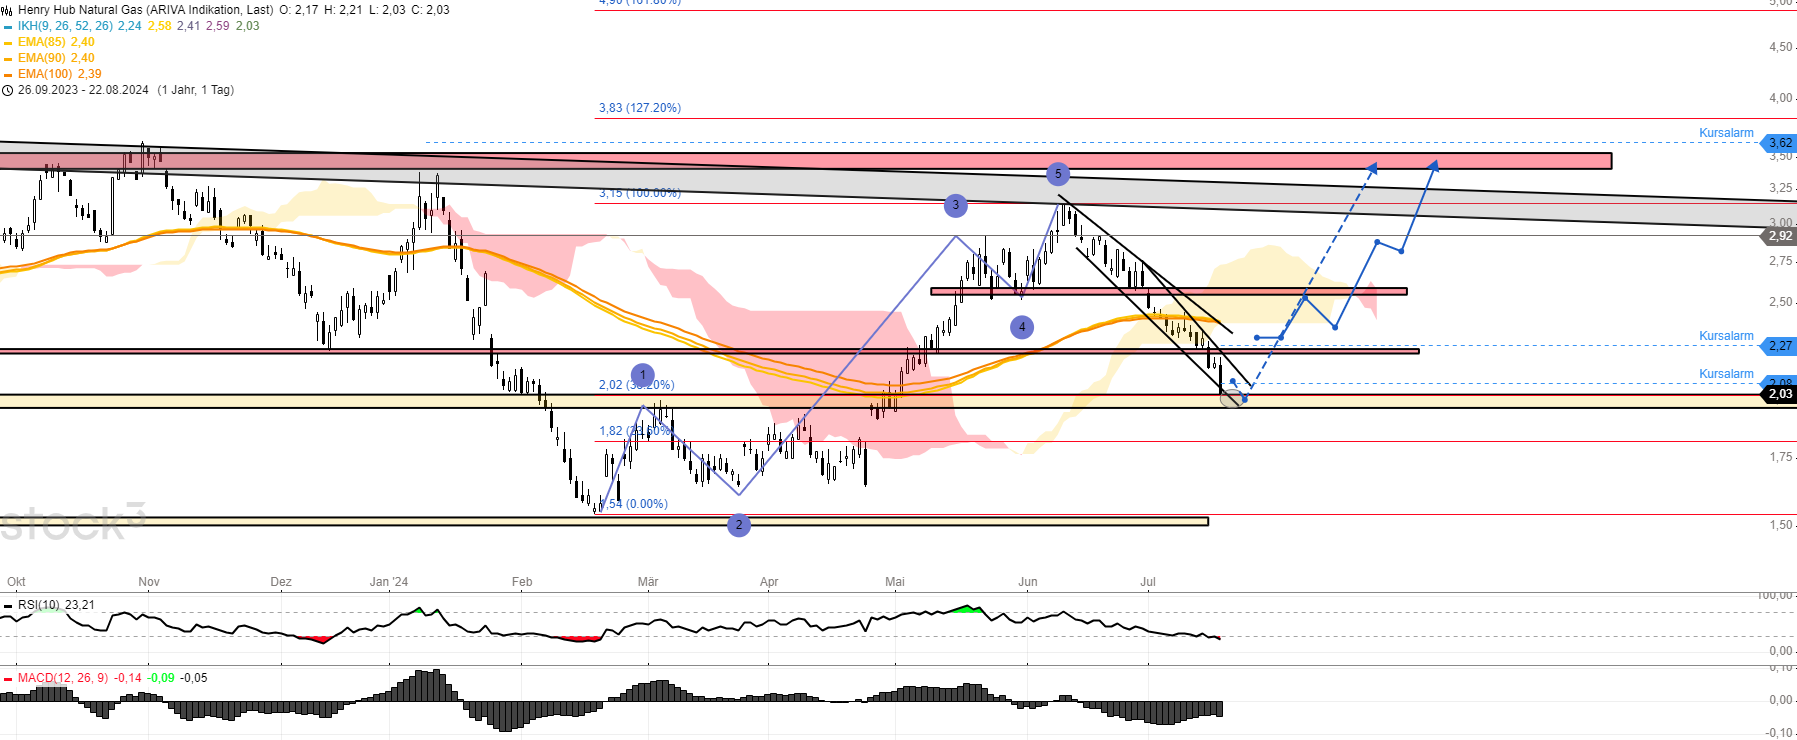
Chart technical outlook
Since the increase in February, the gas price has been on a flawless bullish impulse wave. The resulting correction has been running since mid-June and has reached the ideal trend reversal area of USD 2.04, characterized by massive support and the 38.2 retracement of the previous upward stretch. Here, one could already position oneself anti-cyclically. However, the probability of a trend reversal increases when USD 2.27 is exceeded. I think a price increase to around USD 3.60 is quite likely. The decisive factor for this now is that the gas price does not fall below the USD 1.54 mark.

In addition to the blog that is actively maintained here, my information portal Investment.Traders contains other exciting articles, detailed stock analyses, presentations of various investment opportunities and a weekly update in video form. This is my contribution to financial education in Germany.
Posted in:
Chart analysis
Leave a comment
Related posts
 Munich Re - One record chases the next
Munich Re was founded in 1880 by Carl Thiem, independently of the main company. At the beginning, most reinsurance...
Read more
Eli Lilly - Range breakout sets new all-time highs
The pharmaceutical giant is currently in the process of breaking out of a higher trading range. This would bring...
Read more
Puma - Ideal correction invites you to buy
The shares of the sportswear manufacturer Puma have reached the ideal pullback zone for anti-cyclical long positions....
Read more
AMD shares: AI chips boost the company -- Current buying opportunity
Advanced Micro Devices develops and produces microprocessors for the computer and consumer electronics industry. The...
Read more