Between reality and illusion If you want to know what trading really means—beyond luxury cars, piles of cash, and...
Search in blog
Blog categories
- FAQ – Your guide through the world of finance and technical facilities (2) click
- Daytrading Almanac (27) click
- Press release (23)
- Educational (26) click
- Projects (9)
- Chart analysis (39) click
- Trading bots for cTrader (11)
- AI in trading (5)
- Trading Strategien (11)
- Trading signals and stock market letters (46)
Latest posts

When it comes to traders, social media platforms often create a rather one-sided image: a young face smiling at the...

The TegasFX Instant Funding program sets a new standard for traders seeking quick access to capital without having to...

Backtesting trading strategies is an essential tool for traders who want to validate their methods across historical...

introduction In the world of trading, it can be challenging to balance the intense market activity and the rapid...
Popular posts


Featured posts


Photo gallery
No featured images
Archived posts
Top authors
-
 Christian Lill 70 Posts View posts
 -

-

-

-

Siemens - Will this double top prevail?
Company description
Siemens is a cross-industry company dedicated to automation, electrification, mobility and healthcare. The three largest geographic regions - the United States, Germany and China - account for more than half of the group's revenue. Siemens holds a 75% stake in the separately listed Siemens Healthineer.
DAX weighting of Siemens
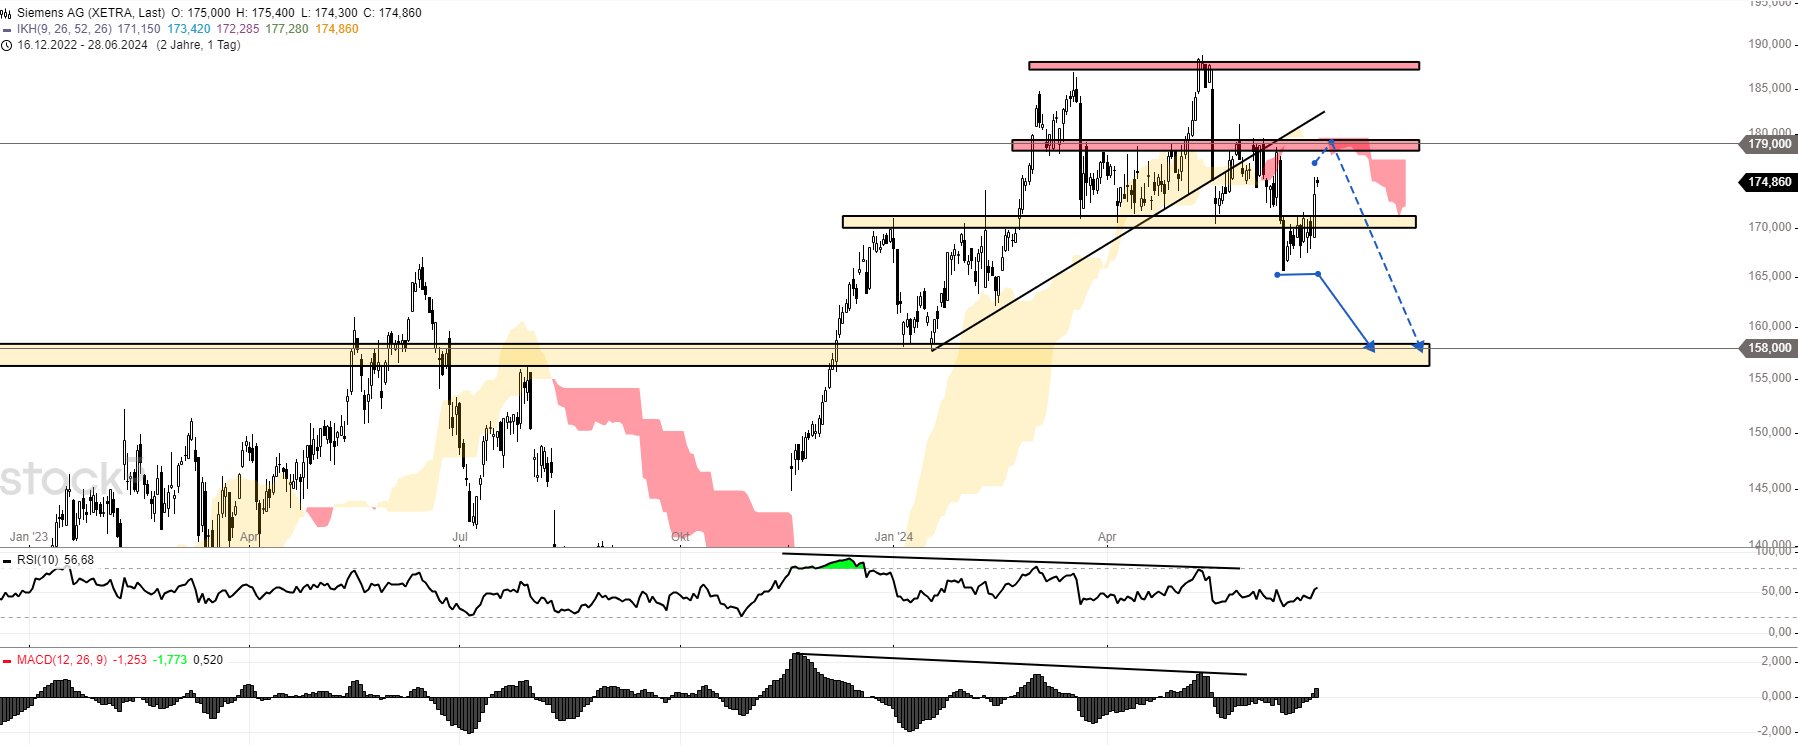
In terms of charts, the share is actually extremely strong in relation to the economic forecasts that are currently affecting us. However, one aspect shows a clear warning sign - the chart structure since mid-March. Since Siemens is weighted at 8.52% in the DAX alongside SAP and Airbus and is therefore one of the biggest drivers of the index, I am monitoring the situation very closely.

Chart technical outlook
But now to the chart structure itself. After the recent record high of EUR 189 in mid-May, Siemens shares are correcting significantly. The current chart formation of a potential double top is a warning to be cautious in the short term. A more significant downward movement to EUR 158 could be on the horizon. Anticyclical levels, where the underlying value could already turn around again, would be favored around EUR 179. This is an important liquidity zone. Above this, however, further upward trends are likely to continue.


In addition to the blog that is actively maintained here, my information portal Investment.Traders contains other exciting articles, detailed stock analyses, presentations of various investment opportunities and a weekly update in video form. This is my contribution to financial education in Germany.
Leave a comment
Related posts
 Munich Re - One record chases the next
 Eli Lilly - Range breakout sets new all-time highs
 Puma - Ideal correction invites you to buy
 AMD shares: AI chips boost the company -- Current buying opportunity
