Between reality and illusion If you want to know what trading really means—beyond luxury cars, piles of cash, and...
Basics
Basics
What is the stock exchange?
The stock market is like a huge, organized marketplace where people and companies can buy and sell stocks (shares in companies) and other securities like bonds. Think of it like a farmer's market, only instead of fruits and vegetables, shares of companies are traded. The stock market allows companies to raise money for growth and offers investors the chance to share in the financial success of those companies. It is a barometer of the economy, as rising prices often indicate a strong economy, while falling prices indicate a weak economy.
Almost anything can be traded on the stock exchange; these are colloquially called symbols or instruments.
- Stocks - Represent ownership shares in companies. Each stock is identified by a ticker symbol, such as AAPL for Apple Inc. or TSLA for Tesla Inc.
- Foreign exchange (Forex) - These are currency pairs whose value indicates the relationship between two currencies. For example, the symbol EUR/USD represents the currency pair Euro against US Dollar.
- Indices - Indices such as the DAX, Dow Jones (DJIA) or S&P 500 combine several stocks into an index that reflects market performance. These are particularly useful when evaluating market trends.
- Commodities - Commodities include metals such as gold (XAU) and silver (XAG), energy sources such as crude oil (WTI or Brent), and agricultural products such as wheat or soybeans. Each commodity has a symbol, often consisting of the initial letters.
- Derivatives - These include futures, options and swaps that are derived from the underlying securities. For example, ES futures represent the S&P 500 Index.
- Bonds - Issued by governments or companies to raise capital. They often have specific metrics such as maturity and interest rate, but are less commonly represented in token form on trading platforms.
7. Cryptocurrencies - Digital or virtual currencies based on blockchain technology. Well-known examples are Bitcoin (BTC), Ethereum (ETH) and Ripple (XRP). Cryptocurrencies are known for their high volatility and their independence from traditional financial systems.
The Chart
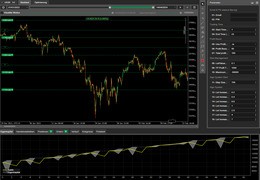
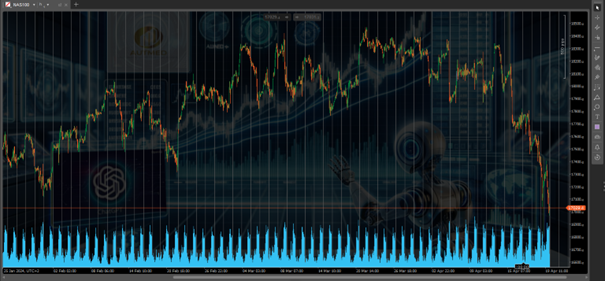
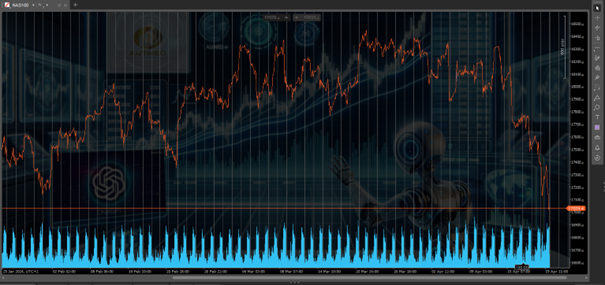
A chart in finance is a graphical tool used to show the price history of securities such as stocks, bonds, commodities or currencies over a specific period of time. It helps investors identify patterns and trends to make informed trading decisions. The most common types of charts are line, bar and candlestick charts. Each chart type provides different information about price movements, with candlestick charts being particularly popular as they show opening, high, low and closing prices within a specific period.
Example 1: Candle chart
Example 2: Line chart
The candle
The candles are drawn from the price level. The most important information for this time unit can all be read in one candle: where was the opening price of the candle, where was the low point, the high point and what was the closing price.
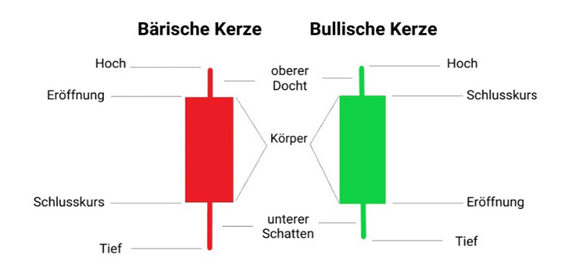
Candle molds
Based on the candle shapes, a trader can estimate possible future price movements. Here are a few examples:
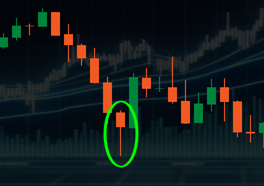
Hammer : Shadow is at least twice as long as the candle body, there may be a small shadow at the top. It doesn't matter whether it's red or green, the position in the chart is what counts. If there is a 60% sign upwards after a downward movement, always place the SL under a hammer.
Shooting Star: long shadow above the candle (at least 2x longer than the body). After a rise, there is a 70% probability of a price drop due to panic selling. Whether red or green does not matter
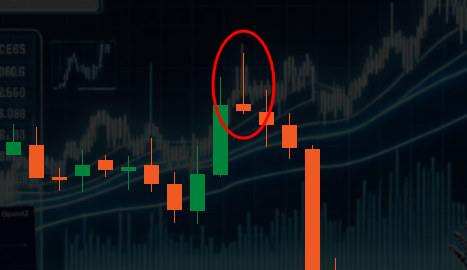
The candlestick shapes are usually part of strategies and should not be considered individually. They are discussed in more detail in advanced strategy courses from trading coaches.
Trading hours
Trading hours and volumes on different markets vary considerably:
- New York Stock Exchange (NYSE): 9:30 a.m. to 4:00 p.m. ET. It is one of the largest stock exchanges in the world, with an average daily trading volume of over $2 trillion.
- NASDAQ: Same times as NYSE; known for high trading volume, especially in technology stocks.
- London Stock Exchange (LSE): 8:00 a.m. to 4:30 p.m. UK time, with a significant share of European market activity.
- Deutsche Börse (Xetra): 9:00 a.m. to 5:30 p.m. CET, plays a central role in European trading.
- Tokyo Stock Exchange (TSE): 9:00 a.m. to 3:00 p.m. JST, with a lunch break, important for the Asian market.
- Forex market: Open 24 hours a day, from Sunday 5:00 p.m. ET to Friday 5:00 p.m. ET, with a massive daily trading volume of about $6.6 trillion.
The biggest movement in the markets is often seen during the overlap of trading hours of the major exchanges. For example:
- New York and London: Between 8:00 a.m. and 12:00 p.m. ET, when both markets are open, there is often increased volatility due to the combined activity of the two largest financial centers.
- Tokyo and London: Shortly after the London opening, when the Asian market is still open, approximately between 3:00 and 4:00 a.m. ET.
- Sydney and Tokyo: Early morning overlap in the Asian session, which is significant for Asia-Pacific currencies.
During these overlaps, trading volume typically increases, which can lead to greater liquidity and faster price movements.
We recommend: look at the market and how it reacted after opening phases or after news. Look for regularities and irregularities. This is the first step towards creating profitable strategies.
important terms
- Share: A share in a company that gives investors the right to a portion of the company's assets and profits, if any are made. Shares are publicly traded on stock exchanges and offer shareholders the opportunity to participate in the company's economic success, either through capital gains or dividends. By buying shares, you essentially become a co-owner of the company.
- Bear Market: A financial term that describes a market or period of market activity in which securities prices are generally falling. This market situation reflects pessimism among investors who expect market conditions to continue to deteriorate. A bear market is often triggered by a general economic slowdown, negative corporate news, or external shocks and is characterized by a decline in share prices of at least 20% from the most recent high.
- Bull Market: A market or a period in the financial market in which the prices of securities are mostly rising. A bull market is characterized by optimism among investors and confidence in the future economic development or positive developments in companies. This market situation often reflects economic growth and can be promoted by various factors such as strong corporate earnings, positive economic data or monetary stimulus. Investors operating in a bull market expect that prices will continue to rise.
- Dividend: A dividend is a payment that a company makes to its shareholders from the profits it has earned. These payments are usually made on a regular basis, for example quarterly, and serve as a direct financial return for investors. The amount of the dividend can vary depending on the company's financial situation and profit policy. Dividends are particularly attractive to investors because they provide a continuous source of income, even when the stock market is volatile.
- Leverage: In finance, leverage refers to the use of borrowed capital to increase the potential return on an investment. By using leverage, traders and investors can take larger positions in the market than their own capital would allow. This can significantly increase profits on successful trades, but also increases risk, as losses are also magnified and can exceed the original equity invested.
Examples of leverage:
Stock trading: A trader could use 10,000 euros of his own capital to buy shares worth 100,000 euros with a leverage of 1:10. If the share price increases by 5%, the trader wins 5,000 euros instead of just 500 euros, which he would have earned without leverage.
Forex trading: A Forex trader uses 1,000 euros to open a position worth 100,000 euros by using a leverage of 1:100. If the exchange rate moves favorably by just 1%, the trader increases his profit to 1,000 euros - i.e. a doubling of the invested capital.
In both cases, leverage increases potential profits, but it also increases the risk significantly, as losses are also amplified and can exceed the original investment.
- Margin: is a type of deposit that a trader must put down in order to trade with leverage. This deposit protects the broker in case the trader incurs losses that could put his account in the red. For example, if you want to buy 10,000 euros worth of stocks with leverage, you may be asked to put down 1,000 euros as margin. This amount will remain locked in your account as long as the position is open.
- Short Selling: Short selling is when a trader sells a security that he does not currently own with the intention of buying it back later at a lower price. This concept is often used when a trader expects the price of the security to fall. The trader borrows the security (for example, stocks), sells it at the current market price, and hopes to buy it back later at a lower price. The difference between the sell price and the buyback price is the trader's profit.
- Lot: A "lot" is a unit size used in trading, especially in the Forex market, to indicate the amount of currency being traded. A standard lot is 100,000 units of the base currency. For example: if a trader buys 1 lot of the EUR/USD currency pair, he is actually buying 100,000 euros. There are also smaller lots: a mini lot is equal to 10,000 units, and a micro lot is equal to 1,000 units. This classification helps traders to accurately determine their trade sizes and manage risk accordingly.
- Pips, Pipettes and Points: In forex trading, a "pip" is the smallest price change a currency can make, typically the fourth decimal place of the exchange rate. For example, if EUR/USD goes from 1.1050 to 1.1051, that is a change of one pip. A "pipette" is even smaller, the fifth decimal place of a rate. "Points" are often used interchangeably with pips, but can also represent larger price changes, depending on market practice. These units are crucial for managing profits and losses in forex trading.
In the context of the financial market, "points" refer to the unit of price change in financial instruments. In most cases, one point corresponds to a price change of 0.01 or one percentage point of the quotation, depending on the product being traded. For example, in bonds, one point represents a change of 1% of the total value. In indices such as the Dow Jones or DAX, one point represents an absolute change of one in the index number, which represents market changes in coarser increments than pips.
10. Volatility: refers to the extent of fluctuations in the price of a financial instrument over a certain period of time. High volatility means that the price of the instrument fluctuates widely, which means higher risks but also potential profit opportunities for traders. Volatility is often caused by economic events, market uncertainty or political instability. In financial markets, traders and investors use volatility to adjust trading strategies, often measured by indicators such as the VIX index.
11. Stop Loss: A stop loss is an order placed by traders to limit potential losses in case the market moves against their position. This order specifies at what price level an open position should be automatically closed to avoid further losses. Stop loss orders are an essential risk management tool that helps control financial risk and reduce the emotional component of trading by making decisions about exiting a position in advance.
The Broker
A broker is an intermediary between buyers and sellers in financial markets. CFD brokers specialize in trading contracts for difference, which allow traders to speculate on price movements of assets without actually owning them.
Important parameters of a CFD broker:
- Regulation: A reputable broker should be regulated by a recognized financial regulator, which guarantees transparency and protection for investors.
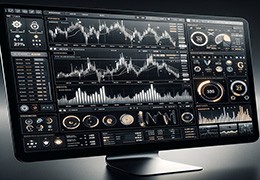
- Trading platform: The platform should be user-friendly, reliable and equipped with advanced trading tools.
- Spreads and fees: Low spreads and transparent fee structures are crucial as they directly impact the profitability of trades.
- Leverage: CFDs are leveraged products, meaning that the broker allows traders to trade larger positions with a smaller capital outlay. The leverage offered varies depending on the broker and asset.
- Customer support: A good broker offers excellent customer support and educational resources to help traders develop.
- Deposit and withdrawal options: The availability of fast and secure transaction methods is necessary for smooth trading.
When selecting a CFD broker, these factors should be carefully considered to ensure a safe and advantageous trading environment.
There are a large number of brokers on the market. Particularly reputable and functional are for automatic trading systems, the broker “Pepperstone” has come to the fore, which I hereby also recommend.

