Between reality and illusion If you want to know what trading really means—beyond luxury cars, piles of cash, and...
Technical Analysis
Technical Analysis
Introduction
Technical analysis is an approach to predicting the future price movements of financial instruments such as stocks, currencies or commodities by studying historical market data, mainly price and volume. It is based on the assumption that market prices move in trends and that these trends can be identified by analyzing market data.
Top Down Method
The top down method of technical analysis begins by examining major indices or markets to determine the general market direction before focusing on specific stocks or assets. This approach helps traders make decisions in line with the larger market trends, thereby minimizing the risk of countermovements.
Trend and trend building
Trend and trend building
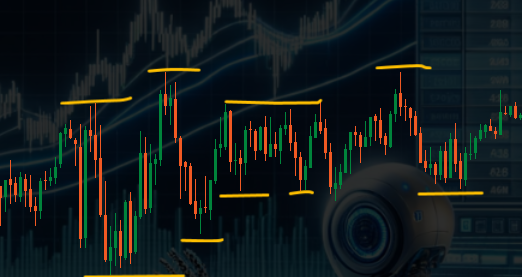
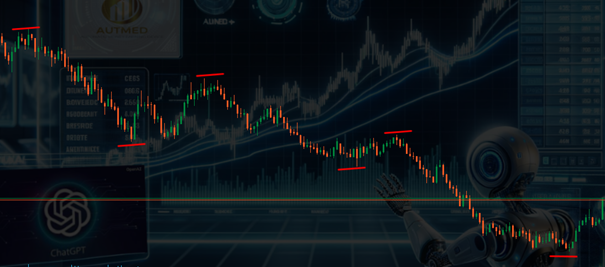
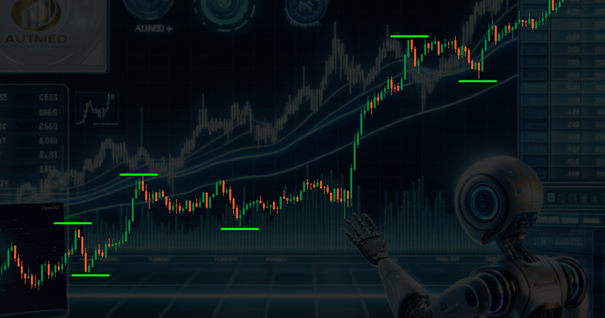
In technical analysis, a trend is the direction in which the market is moving. Trends can be up, down, or sideways. Trend building refers to the patterns and behaviors that lead to the formation of a trend. An ascending trend is characterized by higher highs and higher lows, while a descending trend is characterized by lower highs and lower lows. A sideways trend shows consistent highs and lows. These patterns help traders identify potential entry and exit points and adjust their strategies accordingly.
Example sideways trend:
Example downward trend:
Example uptrend:
Trend phases
In technical analysis, trend phases are considered to be crucial periods in which a trend develops and manifests. These phases can be divided into three main categories:
- Accumulation Phase: This is often the beginning of a new trend, where informed investors begin to build positions before the general public does. During this phase, the market is often relatively flat as the previous trend fades and the first signs of a new trend emerge.
Example accumulation phase:
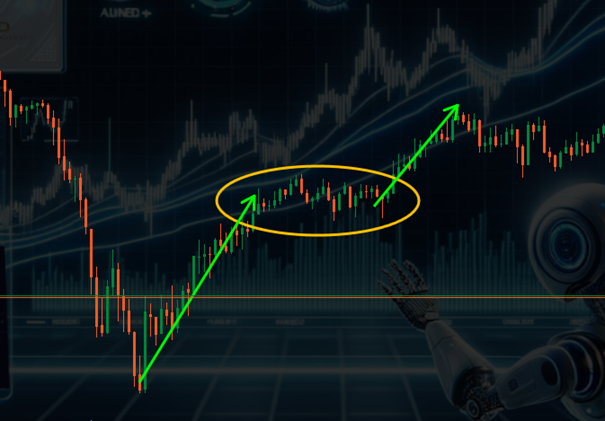
- Participation phase: This is where the majority of traders and investors enter, which strengthens the trend and moves prices significantly in the direction of the trend. This phase is characterized by increased trading activity and rising prices in an uptrend or falling prices in a downtrend.
Example participation phase:

- Distribution phase: In this phase, early investors start to realize their profits and the trend gradually loses strength. This can lead to a trend reversal if enough market participants decide to close their positions.
Example distribution phase:
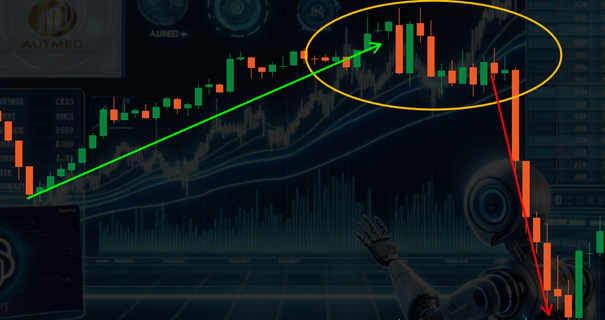
Recognizing these phases can help traders plan their entry and exit strategies more effectively and minimize risk.
Trend line and trend channels
Trend lines and trend channels are important tools in technical analysis that serve to visualize the direction and stability of a trend.
- Trendlines are straight lines drawn either below the lows (in an uptrend) or above the highs (in a downtrend) of a price chart. They help identify the support or resistance levels where prices tend to reverse.
Example 1 trend line:
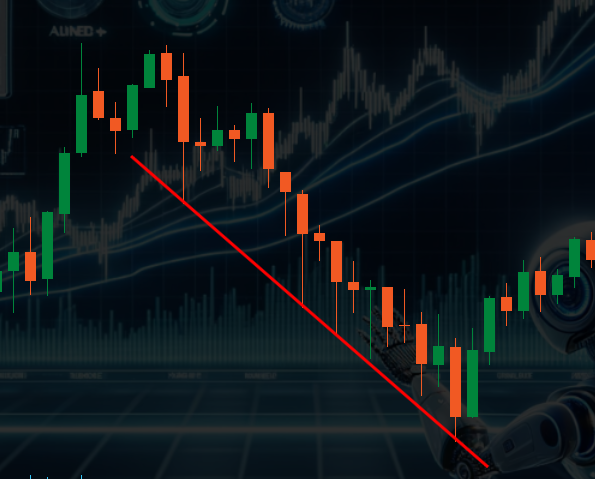
Example 2 trend line:
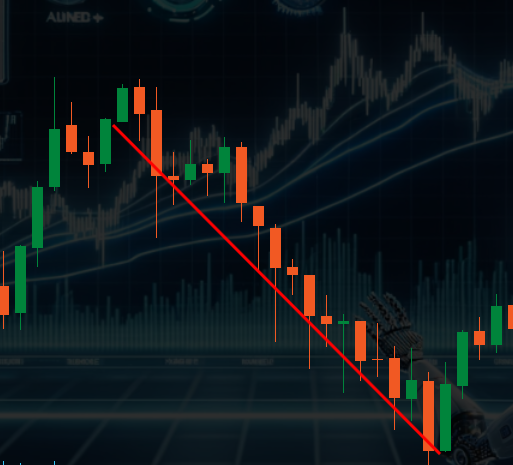
Some traders prefer the candle bodies, others the ends of the candle wicks. The idea behind trend lines is that when trends emerge, you continue to draw them and enter a position at the trend line accordingly.
- Trend channels extend this concept by drawing a second line parallel to the trend line. This creates a channel that further defines price movements. An ascending trend channel shows rising highs and lows, while a descending trend channel shows falling highs and lows.
Example trend channel:
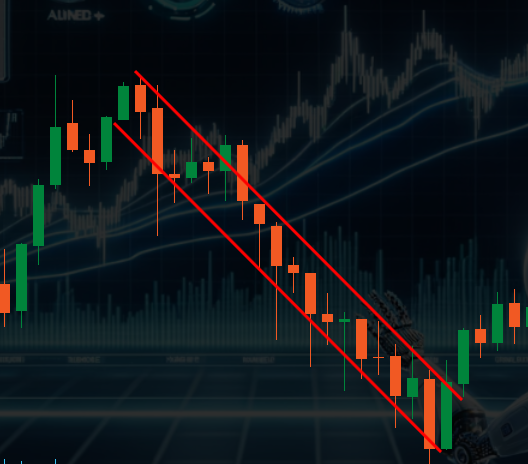
As can be seen in this example of a trend channel, not everything on the chart is perfectly symmetrical. There are always small outliers up and down.
These tools are particularly useful for determining possible entry and exit points in the market and assisting with risk management by indicating areas where trends may lose strength or break.
Support and resistance
Support and resistance are basic concepts in technical analysis that describe areas on the chart where the price tends to stop and reverse. Important zones for support and resistance are primarily value area low, value area high, imbalances, hourly reversals, VPOC, pivot points, etc. However, this basic course will not cover these in more detail.
- Support is the level below which the price rarely falls. It is considered the floor from which the price tends to bounce upwards.
Example support:

- Resistance is the level above which the price rarely rises. It acts as a kind of cap that pushes the price down.
Example resistance:

These levels are identified by observing price history where the price repeatedly stops falling or rising. They are important for setting stop loss and take profit orders as they often mark areas where prices show significant reactions.
Retracements
Retracements are temporary price declines within a larger market trend, often viewed as corrections to the larger price trend. As part of technical analysis, traders use retracements to identify potential entry points in the direction of the prevailing trend. They are often determined by Fibonacci levels or other technical indicators that show how deep a decline is likely to be before the original trend resumes. Retracements are particularly useful in strongly trending markets to find favorable buying or selling moments within a larger trend.
Example Fibonacci Retracements:
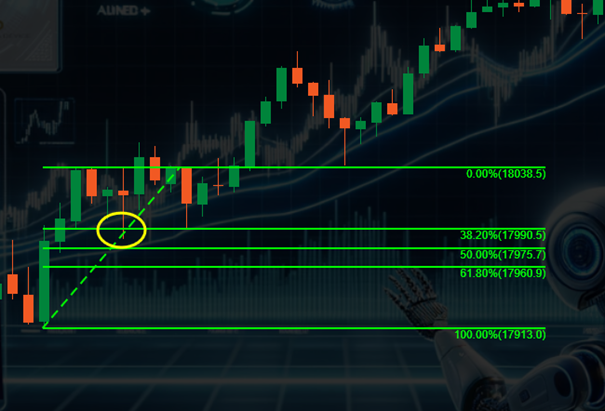
In this case, a buy limit order could have been placed at the 38.2% level. However, the levels vary greatly between the tradable symbols. The 50% and 70% levels are often even more significant.
Chart formations
Chart patterns are patterns that can be seen in the price history of a security on a chart and are used by traders to predict future market movements. These patterns can be divided into two main categories: continuation patterns, which indicate that an existing trend is likely to continue, and reversal patterns, which indicate an impending trend reversal. Popular examples of chart patterns include triangles, flags and pennants (continuations), and double tops and double bottoms (reversals). Traders use these patterns to determine entry and exit points. Here are a few examples:
Example Bullish Flag:
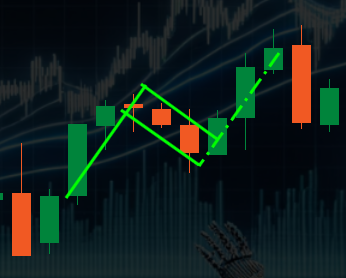
A bullish flag must have at least three support points of the candle body corners. It has a probability of about 66% that it will come up, as in this example.
Example rectangle:
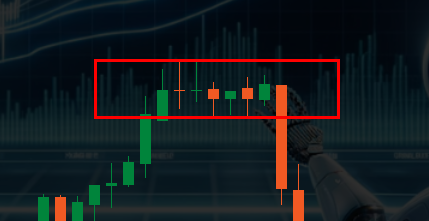
With a rectangle, you could trade the breakout from it or dare to enter aggressively by trading on the outer edge in the opposite direction
There are a number of other formations such as various triangles, double top, double bottom, shoulder-head-shoulder, etc. However, these will not be discussed further in this basic course as they go beyond the basic knowledge.
Indicators
Indicators in technical analysis are mathematical calculations based on historical price and/or volume data of a security and are used to predict future market movements. The most common indicators include:
- Moving Averages : Show the average price of a security over a certain period of time and smooth out price fluctuations.
Example exponential moving average 14:

- Relative Strength Index (RSI) : Measures the magnitude of price gains compared to price losses and signals overbought or oversold conditions.
Example RSI14:

- MACD (Moving Average Convergence Divergence) : Shows the convergence or divergence of two moving averages.
Example MACD histogram:

- Bollinger Bands : Consist of a middle band (a moving average) and two outer bands one standard deviation away from the middle band that indicate market volatility.
Example Bollinger Bands 20:
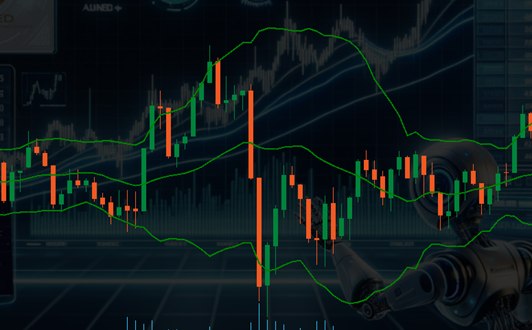
These indicators help traders spot trends, identify potential reversal points and make trading decisions.
Conclusion on indicators: There are countless indicators. However, many indicators always say the same thing. Basically, indicators only ever reflect past values. Indicators also only work in certain market phases. If the market changes, the set values of the indicators also change, which may make them useless. There is no "holy grail" of indicators. In combination, however, they can form a good basis for trading decisions. The trading platforms usually offer the "standard indicators" free of charge. Special indicators are provided by and for members of the AIFAE, for example.
Example analysis
Example analysis with technical indicators:
Let's imagine we analyze Company X's stock using the Moving Average (MA), Relative Strength Index (RSI), and Bollinger Bands to make an informed trading decision:
- Moving Average: Company X's stock recently broke above the 50-day MA, indicating a possible uptrend.
- RSI: The RSI reading is at 70, which is close to the overbought zone. This could indicate that the stock is overvalued and could possibly see a correction soon.
- Bollinger Bands: The price touches the upper band, which together with a high RSI could indicate an overbought phase.
Based on this analysis, traders could consider opening a position if further signals confirm a continuation of the uptrend or locking in profits if they are already invested in the stock to protect against a possible reversal.


